Manuál Salter 9176 WHSV3R Curve Váhy
Potřebujete manuál pro svůj Salter 9176 WHSV3R Curve Váhy? Níže si můžete zdarma prohlédnout a stáhnout PDF manuál v češtině. Tento produkt má aktuálně 4 často kladené otázky, 1 komentář a má 0 hlasů. Pokud toto není manuál, který chcete, kontaktujte nás.
Je váš výrobek vadný a manuál nenabízí žádné řešení? Přejděte do Repair Café a získejte opravu zdarma.
Manuál
Loading…

Loading…
Hodnocení
Ohodnoťte Salter 9176 WHSV3R Curve Váhy a dejte nám vědět, co si o výrobku myslíte. Chcete se podělit o své zkušenosti s tímto výrobkem nebo se na něco zeptat? Nechte nám ve spodní části stránky komentář.Více o tomto návodu
Chápeme, že je hezké mít k vašemu Salter 9176 WHSV3R Curve Váhy papírovou příručku. Manuál si můžete vždy stáhnout z našich webových stránek a vytisknout si jej sami. Pokud byste chtěli mít originální příručku, doporučujeme vám kontaktovat Salter. Možná by byli schopni poskytnout originální návod. Hledáte příručku ke svému Salter 9176 WHSV3R Curve Váhy v jiném jazyce? Vyberte si preferovaný jazyk na naší domovské stránce a vyhledejte číslo modelu, abyste zjistili, zda jej máme k dispozici.
Specifikace
| Značka | Salter |
| Modelka | 9176 WHSV3R Curve |
| Kategorie | Váhy |
| Typ souboru | |
| Velikost souboru | 3.5 MB |
Všechny návody pro Salter Váhy
Další manuály Váhy
Často kladené otázky o Salter 9176 WHSV3R Curve Váhy
Náš tým podpory vyhledává užitečné produktové informace a odpovídá na často kladené otázky. Pokud v nich najdete nějakou nepřesnost, kontaktujte nás prostřednictvím našeho kontaktního formuláře.
Moje váha ukazuje nerealisticky nízkou hmotnost, když na ni stojím, proč? Ověřeno
Abyste dosáhli co nejlepšího výsledku, měla by váha stát na tvrdém vodorovném povrchu. Pokud váha stojí například na koberci, může to ovlivnit měření.
To bylo užitečné (2729) Přečtěte si víceCo je BMI? Ověřeno
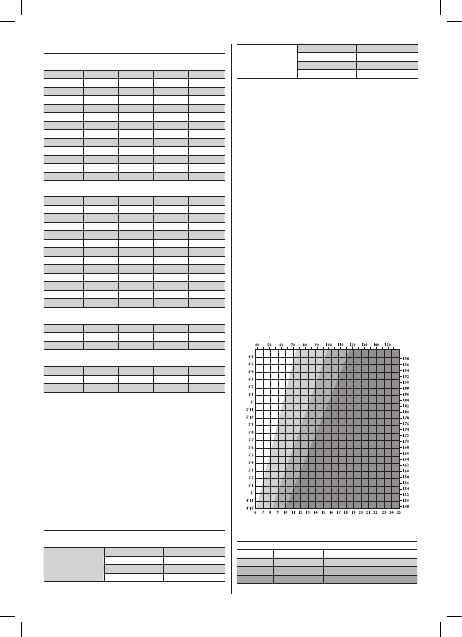
BMI je zkratka pro Body Mass Index a tuto hodnotu lze vypočítat vydělením hmotnosti v kilogramech výškou uvedenou v metrech na druhou.Například někdo s hmotností 70 kilogramů a výškou 1,75 m má BMI 22,86.Za zdravý je považován BMI mezi 18,5 a 25.
To bylo užitečné (1880) Přečtěte si víceBaterie v mém zařízení je oxidována, mohu ji přesto bezpečně používat? Ověřeno
Ja, zařízení lze stále bezpečně používat. Nejprve vyjměte oxidační baterii. Nikdy k tomu nepoužívejte holé ruce. Poté očistěte přihrádku na baterie vatovým tamponem namočeným v octě nebo citronové šťávě. Nechejte zaschnout a vložte nové baterie.
To bylo užitečné (865) Přečtěte si víceMohu použít váhu s mokrýma nohama? Ověřeno
To záleží na měřítku. Při použití diagnostické stupnice je nutné, aby vaše nohy byly suché, abyste mohli správně provádět měření.
To bylo užitečné (568) Přečtěte si více


Zapojte se do konverzace o tomto výrobku
Zde můžete sdílet, co si myslíte o Salter 9176 WHSV3R Curve Váhy. Máte-li dotaz, nejprve si pozorně přečtěte návod. Žádost o příručku lze provést pomocí našeho kontaktního formuláře.
odpověď | To bylo užitečné (0) (Přeloženo Googlem)